

In service since 1998
MOL turns meter readings into invoices, tariff decisions and carbon reports.
Metering systems are usually sold as three products from three vendors: a head-end system that collects data from the meters, a meter data management system that validates it, and a billing system that produces invoices from it. MOL does all three. It collects data from any major meter, validates it to a standard that can be defended at audit, bills from it, and produces the reports that large corporates now need for emissions as well as for cost. MOL was written by PMT and has been in service since 1998.
- 01
Acquire
Half-hourly interval data from virtually any revenue-grade meter used in South Africa, over power line, cellular or IoT (internet of things) networks. MOL was designed to be meter-agnostic from the start.
- 02
Validate
Rule-based validation, estimation and editing. Every reading carries a state (raw, valid, verified or estimated), so no reading is billed without a record of where it came from.
- 03
Bill
Any South African tariff, including time-of-use, sliding-window demand, inclining block and seasonal tariffs. Summated accounts diversify demand correctly, and billing cycles can straddle a tariff change.
- 04
Analyse
Load profiles, consumption comparisons, weather-normalised baselines, and benchmarking by the measure each industry uses, such as sales, covers, rooms or tonnes.
- 05
Report
Management, operational and site dashboards; financial and engineering reports; and emissions data per site and per tenant, in the portal or through the API into your own systems.
Meter data management
Every value is stored with its source and its history.
MOL's meter data management system (MDMS) sits between data collection and everything that depends on it: billing, tariff modelling and emissions reporting. It validates each interval against configurable rules and stores the history of every value with the value itself: its state, which check it failed, who verified it and whether it was estimated.
Queries are resolved against that record. A tenant disputing a recovery, an auditor testing a carbon figure and a municipality defending a demand charge all need an answer that will stand up when it is checked.
The same record makes it possible to act on an anomaly. A failed check with its history attached shows whether the cause is a metering fault, a genuine change in the load, or a communications gap that has since been recovered.
Raw
As received from the meter. Unaltered and not yet validated.
Valid
Passed every automated check and can be billed.
Verified
Failed a check, was investigated, and was confirmed by a person.
Estimated
Could not be recovered, so it was calculated and is labelled as estimated.
The estimated state matters most when a customer queries a bill. Estimation is acceptable, provided every estimated reading is labelled as such.
One system in place of the usual three.
These functions are normally separate products, usually from separate vendors: a head-end system to collect data from the meters, a meter data management system to validate it, and a billing system to produce invoices. Asset and fleet management is often kept in a spreadsheet.
Each boundary between systems requires an integration project and a separate support contract, and is a point where data is copied and the copies begin to differ. When a number turns out to be wrong, each vendor can reasonably point to the system upstream of its own.
MOL combines all of these in one system. When a bill is queried, each invoice line can be traced back through the tariff to the validated interval, to the raw reading, and to the phasor snapshot taken when that reading was collected. There is one audit trail and one accountable party.
Multi-vendor acquisition
MOL reads the meters you already have.
DLMS (the international standard for meter data exchange) was intended to make meters interoperable. In practice each manufacturer implements its own variant, so most systems can read only the meters their own vendor sells. This is why suppliers so often begin by proposing to replace a customer's meters.
PMT holds protocol agreements with most of the major meter manufacturers represented in Southern Africa, and MOL was written to be meter-agnostic from the start. An estate assembled from three vendors over two decades can be read into MOL.
No wholesale meter replacement
A rollout starts by reading the meters already installed. Working meters stay in service, and capital is spent where it is needed.
No vendor lock-in
MOL does not restrict your choice of meters. Hardware can be tendered competitively on price and specification, without first confirming that the system can read it.
One view of a mixed estate
Electricity, water, gas and heat meters from different manufacturers and generations are reported through the same hierarchy, on the same half-hourly basis.
Emissions reporting
A carbon figure depends on what generated the energy and who consumed it.
Neither can be answered from a utility invoice. An invoice gives a total for a period and a supply point. It does not show which half hours were supplied by the grid and which by on-site generators, or which tenant consumed them.
Both distinctions change the reported figure, and both are made at half-hourly resolution. MOL already holds data at that resolution.
What generated it
Load-shedding moves emissions between scopes.
Grid electricity is Scope 2: indirect emissions, calculated at the national grid factor. Diesel burnt on site is Scope 1: direct combustion, attributed to whoever has operational control, at a much higher intensity than grid supply.
An afternoon on generators therefore costs more, and it also moves that consumption from one scope to another and changes the emission intensity applied to it. MOL already separates the two. The conditional virtual meters that recover the cost of running generation also identify exactly which intervals the generators supplied.
Who consumed it
Sub-metering replaces floor-area estimates.
A landlord reporting on operational control separates common-area consumption, which is the landlord's own, from tenant space, which is downstream. Where a building is not sub-metered by tenant, the accepted fallback is to apportion consumption by floor area.
Apportioning by floor area is an estimate, and it gives the wrong result in any building where a restaurant and an office occupy the same floor area. Sub-metering replaces the estimate with a measurement and prevents the same kilowatt-hour from being counted twice.
Where the standards are heading
Proposed Scope 2 rules move from annual to hourly matching.
The GHG Protocol, the most widely used greenhouse gas accounting standard, is revising its Scope 2 guidance. Under the market-based method, a company reports its electricity emissions using contractual instruments such as the renewable energy it has contracted to buy. The current proposal would require those instruments to be matched hourly rather than netted off across a year, and names load profiles as one of the mechanisms that make this workable. It is still a proposal, and the final text is not expected before late 2027.
The direction of the revision is clear, and it disadvantages organisations whose only evidence is their invoices. An organisation already collecting validated half-hourly data per supply point has the data this requires. One reconstructing consumption from monthly totals does not, and cannot recover it retrospectively.
0.906
kgCO₂e per kWh
South Africa's grid emission factor for 2023, published in 2025 by the Department of Forestry, Fisheries and the Environment (DFFE). It is among the highest in the world, which is why consumption is worth measuring accurately.
R308
per tonne, from January 2026
Phase two of the carbon tax, up from R236. It runs to 2030, with free allowances declining over the period.
2026
Carbon budgets become mandatory
Affected companies must register, set a company-level budget, file a mitigation plan and report annually. The first commitment period began in January.
MOL is not a carbon accounting package and we do not sell it as one. It holds the data those packages find hardest to obtain: consumption per site and per tenant, per half hour, separated by source, validated, and with every estimated interval labelled as estimated.
Checking every invoice by hand requires a large team.
A large portfolio receives thousands of utility invoices a month. Each runs to dozens of tariff line items, and each must be checked against what the meters recorded. The calculations are simple, but the volume is large.
Most portfolios therefore check a sample and pay the rest. An error in the supplier's favour among the unchecked invoices is never found.
Each account is valued three ways and tested twice.
Each account is valued three ways: the statement the site received, the utility's own line-item detail behind it, and the same tariff applied to the client's own check meter.
These values are used for two separate tests. The first is whether the utility's detail reconciles to the statement it sent. The second is whether the same tariff, applied to the client's metering, agrees with the amount billed. An account must pass both tests to be cleared without manual review.
| Site | Statement | Bill detail | Your meters | Status |
|---|---|---|---|---|
| Kestrelvale Mall | R 142,860.44 | R 142,860.44 | R 141,993.18 | AgreesWithin tolerance on both checks. |
| Kestrelvale Mall - Liquor | R 9,204.17 | R 9,204.17 | R 9,188.02 | AgreesWithin tolerance on both checks. |
| Tambotiehof Retail Park | R 204,118.72 | R 187,650.31 | R 187,402.88 | QueryThe utility's own detail does not add up to the statement it sent. |
| Quiverfield Centre | R 318,442.09 | R 318,442.09 | R 291,204.63 | QueryYour metering is 8.6% below what was billed. |
| Aloeboom Depot | R 96,331.05 | R 96,331.05 | R 96,102.44 | AgreesWithin tolerance on both checks. |
OCR that reads tariffs
Scanning documents with OCR (optical character recognition) is established technology. The difficulty lies in interpreting the result: identifying the fields on an unfamiliar statement and reading them against the tariff they were billed on, so that the invoice can be rebuilt as structured data. MOL was first proved on Eskom accounts, deliberately, because they carry the most complex tariffs in the country.
Failures are set aside for review
Every individual charge is summed and checked against the statement total. Any account that does not reconcile is set aside for a person to review rather than passed downstream. Accuracy across thousands of accounts is consistently better than 97.5 per cent. This is better than manual capture, and unlike manual capture the system reports its own failures.
Ten data capturers
One person, a few hours
Days to capture
Minutes
Paid, then queried
Approved before the due date
Capabilities
What's in MOL
MOL has eight capabilities, all on one repository. Each has its own page.
Meter data management
Validation, estimation and editing against configurable rules. Gap, spike, reactive-energy and high/low usage checks, with anomalies escalated for inspection rather than silently estimated.
02Data visualisation
Load profiles, heat maps, baseload analysis and period comparison. Most consumption problems appear as a change in the shape of a profile before they appear in the totals.
03Dashboards
Management, operational and site-level views. An overview of the whole estate for a financial director, and a queue of exceptions for the staff who resolve them.
04Tariff & billing
A tariff team tracks Eskom, municipal and NERSA tariff changes. Eskom Megaflex has eleven separate charge components, and MOL models all of them.
05Virtual meters
Mathematical metering points where a physical meter is not feasible, including standby generation recovery. Vector summation across all four quadrants means diversified maximum demand is calculated correctly.
06Prepayment
Prepayment for commercial tariffs an STS meter cannot handle: time-of-use, maximum demand, common-area apportionment, multiple utilities on one balance.
07Engineering diagnostics
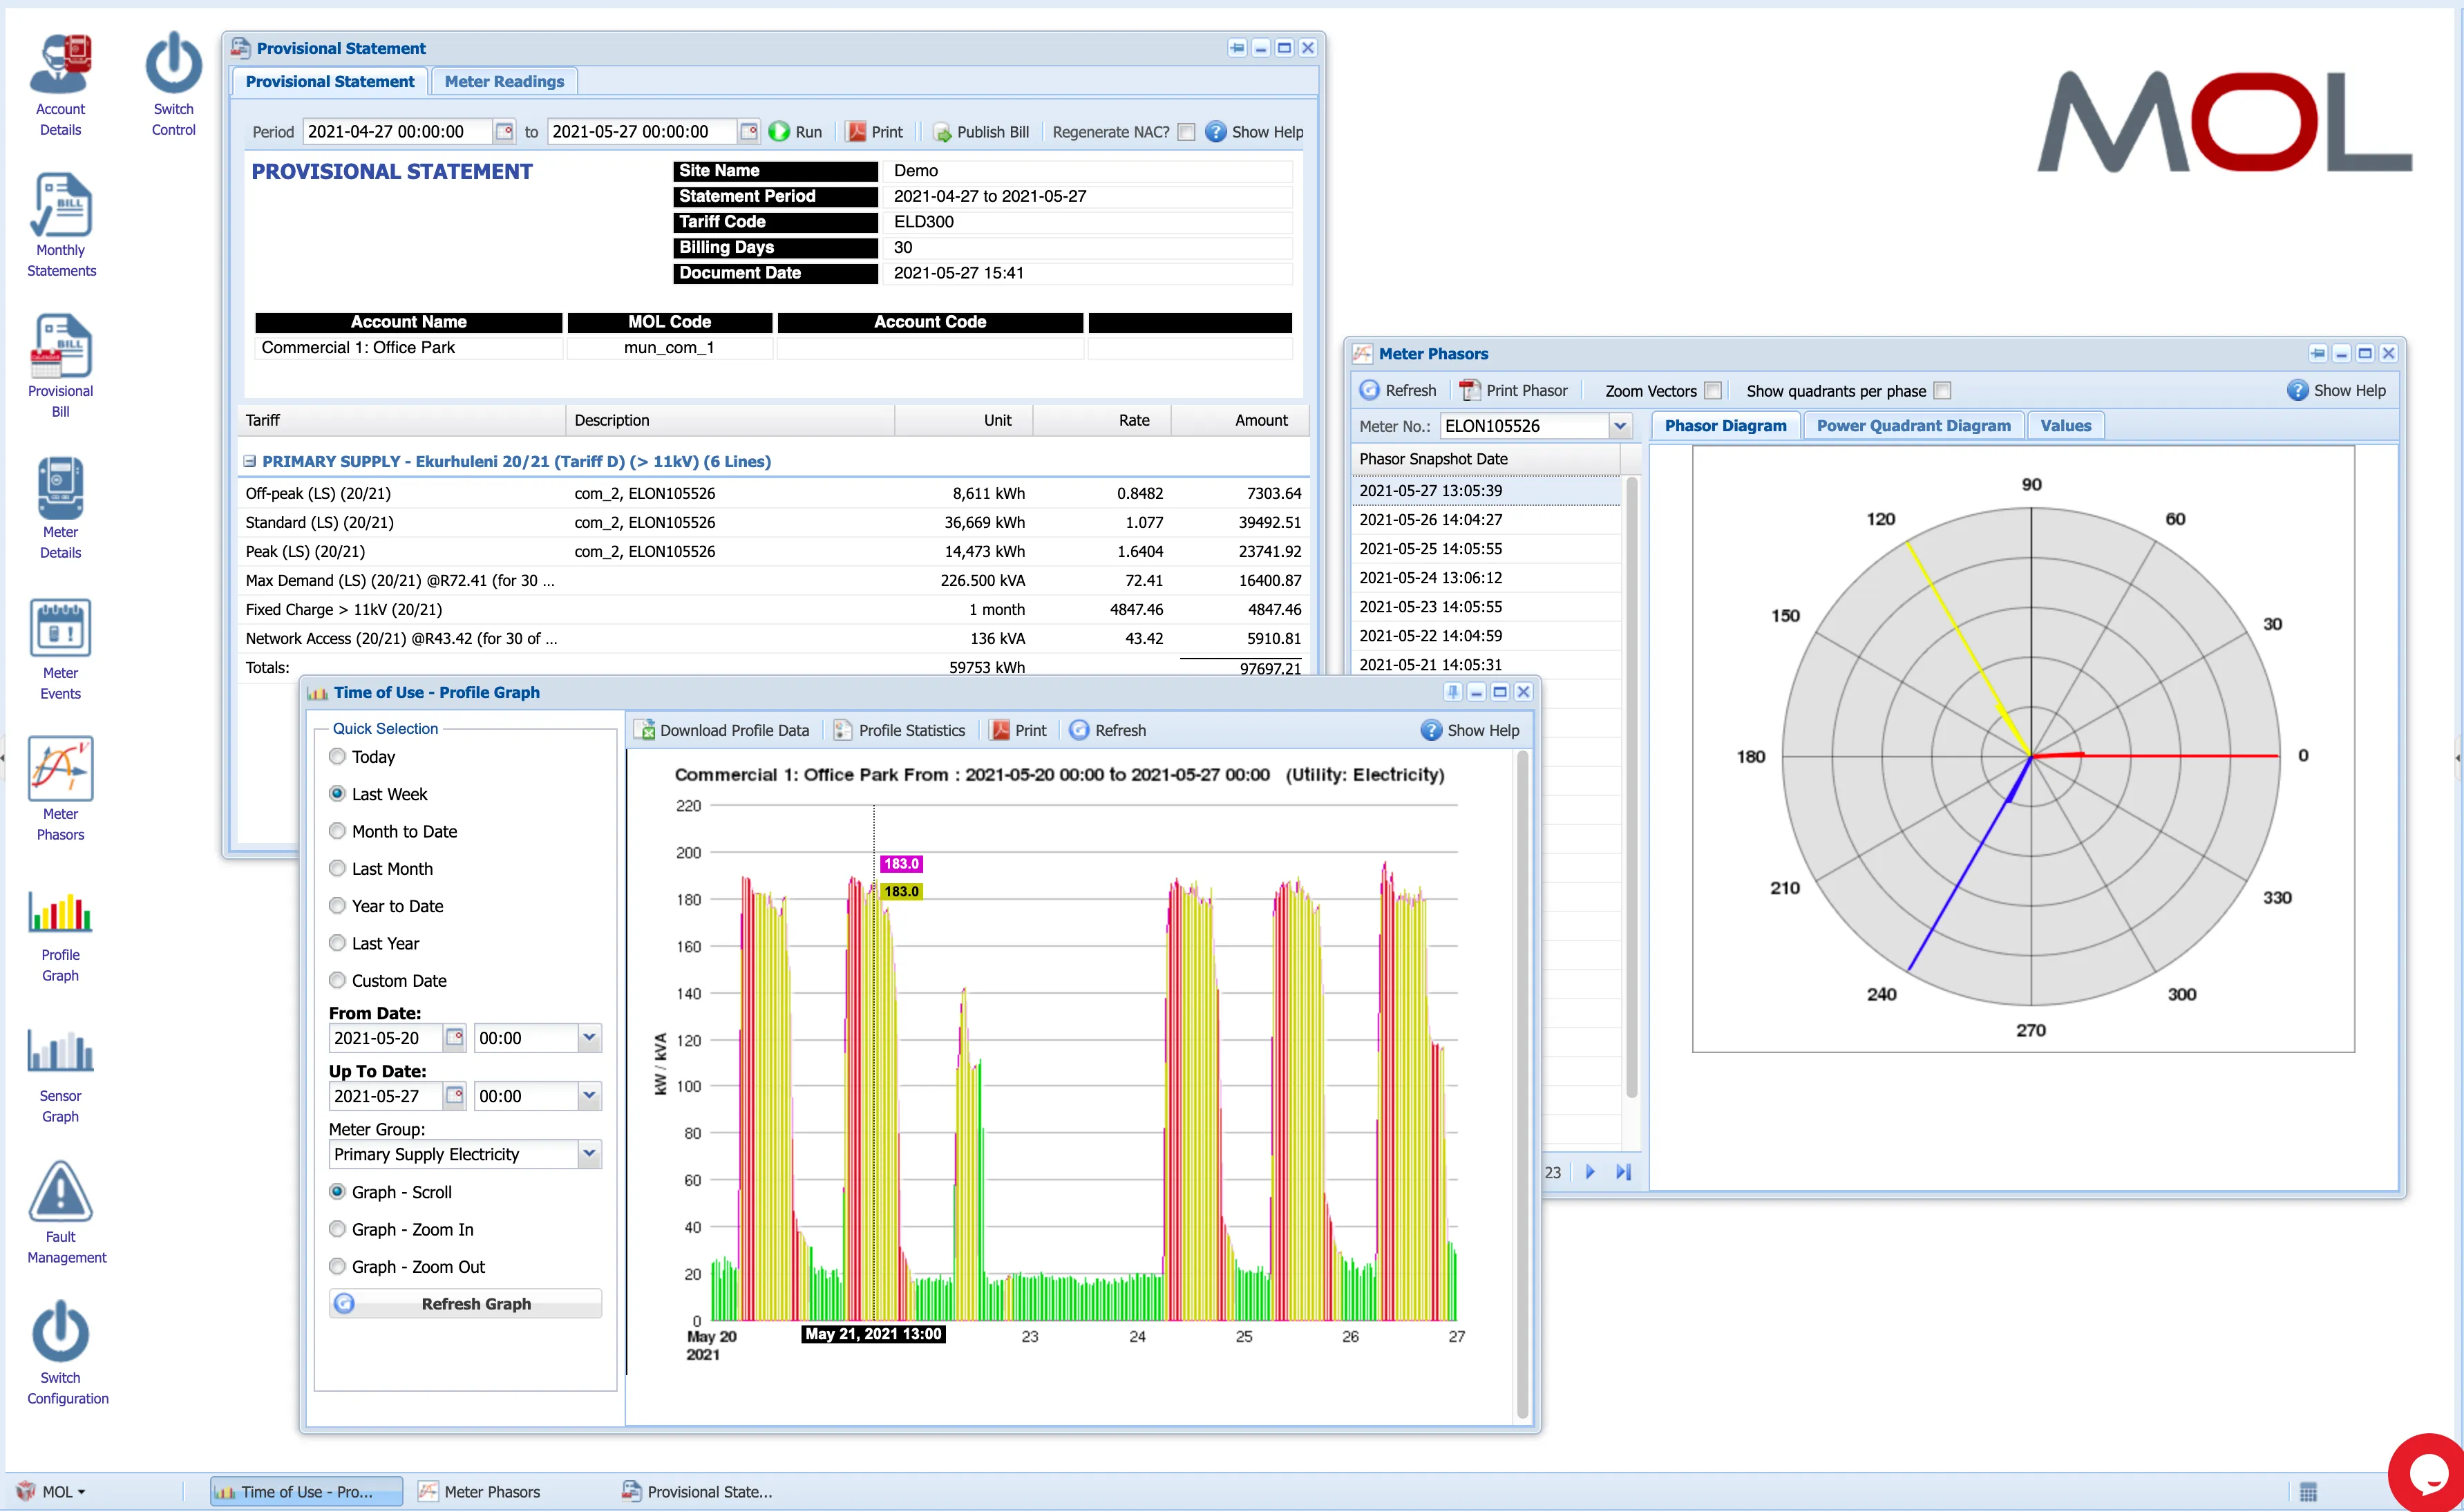
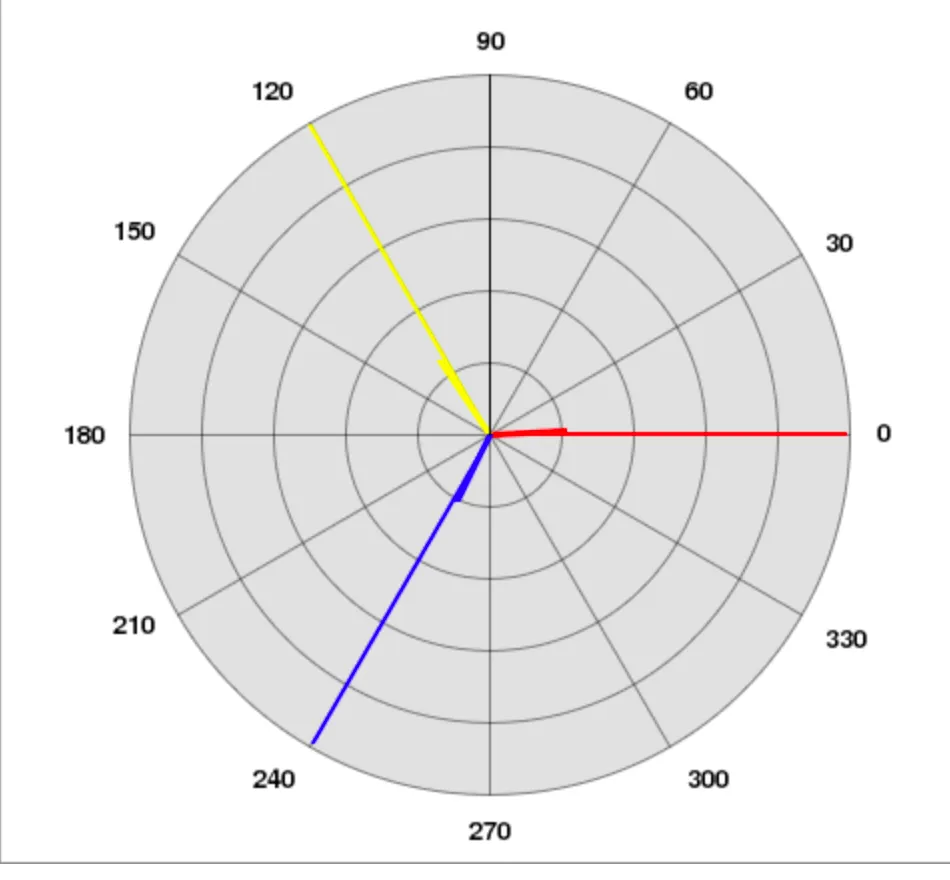
A phasor snapshot each time a meter is read, the events the meters report (tamper, phase loss and reverse energy), and a last-gasp notification from PMT's gateways when supply is lost.
08API
A documented JSON API over the meter register and the interval data. Each meter can be reached by building, by cost centre or by single-line diagram, because these three hierarchies do not align and different users need different ones.
How it is delivered
Delivered as a service, with nothing to install or license.
MOL is delivered as software as a service (SaaS). There are no servers or applications to install at your site. All functions are reached through the web portal, with roles and privileges set per user. PMT was selling metering this way before the term SaaS existed.
MOL is built on open-source infrastructure throughout. No proprietary third-party software or hardware that requires licensing is used anywhere in the stack, which is why PMT can change any part of it when a customer needs a change.
- Delivery
- Cloud SaaS · no client-side install
- Access control
- Granular roles · two-factor authentication · full audit trail
- Availability
- High-availability database cluster · off-site disaster recovery
- Ownership
- Every line developed and maintained in-house