Consumption Models
Managing energy consumption in a commercial building is a complex task. Most energy budgets look to the past - they start with the assumption that next year will look very much the same as last year, and then layer on a fudge factor for rate increases or major occupancy changes without really looking at the underlying causes of consumption patterns or anomalies.
The results are predictably inaccurate. Fortunately, there is a better way.
Meteringonline allows users to define models that define acceptable energy consumption in key areas within a building. For example, a supermarket could have refrigeration, air handling units, lighting and certain departments such as delis, butcheries and bakeries defined as key consumption areas. The models are created using knowledge of the installed plant and various operational periods such as night time usage, preparation, trading and merchandising as a basis. These models serve as a prediction of energy consumption in each of these areas under "ideal" conditions for every operation period with a granularity of every half hour.
The models also take seasonal changes such as winter and summer and peak trading periods such as Christmas holidays and Easter into account to allow for obvious variances in consumption due to these external conditions.
Meteringonline is then configured to generate a simple one-page report at required intervals, usually daily or weekly. These reports, or dashboards, show the variation of actual consumption against the model for the period under review for every half hour during the day.
Consumption outside of the theoretical limit for each model is considered to be wastage and is clearly indicated on each dashboard with supporting tabular data providing more detail. Each store is also compared with its peers (stores in the same region) providing a simple ranking mechanism to allow comparative analysis.
These dashboards are be automatically generated and transmitted to store managers and other designated personnel on a daily or weekly basis. Weekly and monthly summarised dashboards can also be configured to be sent to designated managerial personnel.
MOL Interval Data Analytics
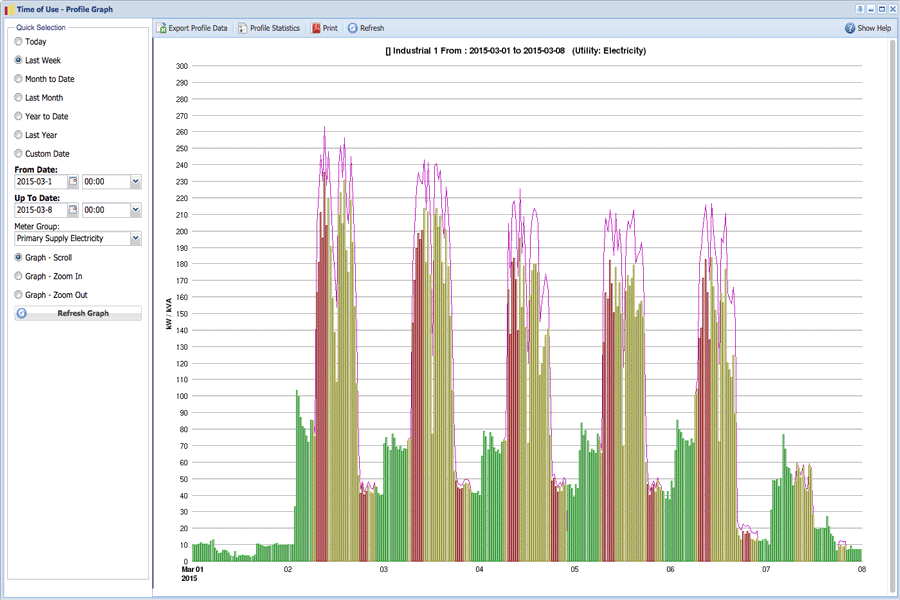
Load Profile graphs
Load Profile graphs provide an interactive graphical representation of interval data.
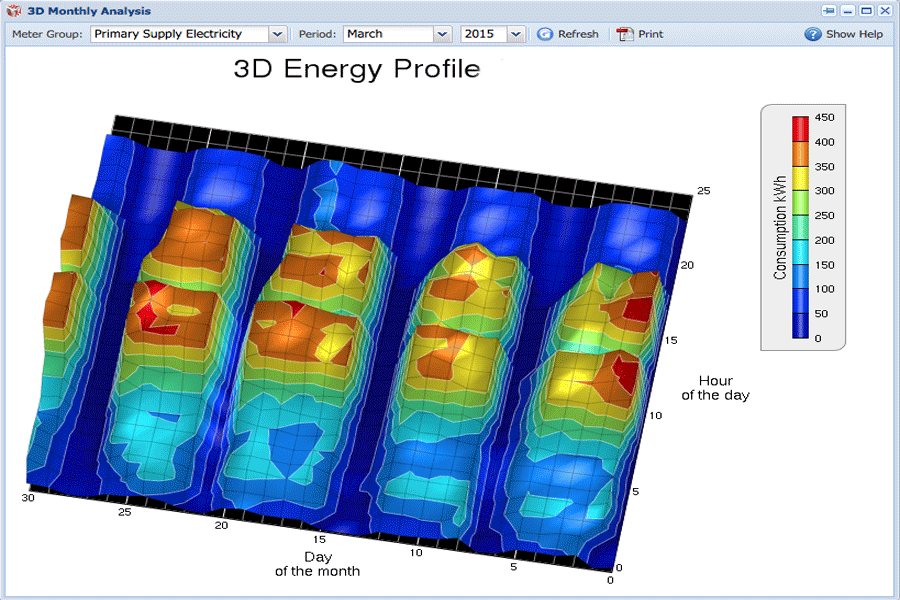
3D profile graphs
3D Profile graphical representations of interval data.
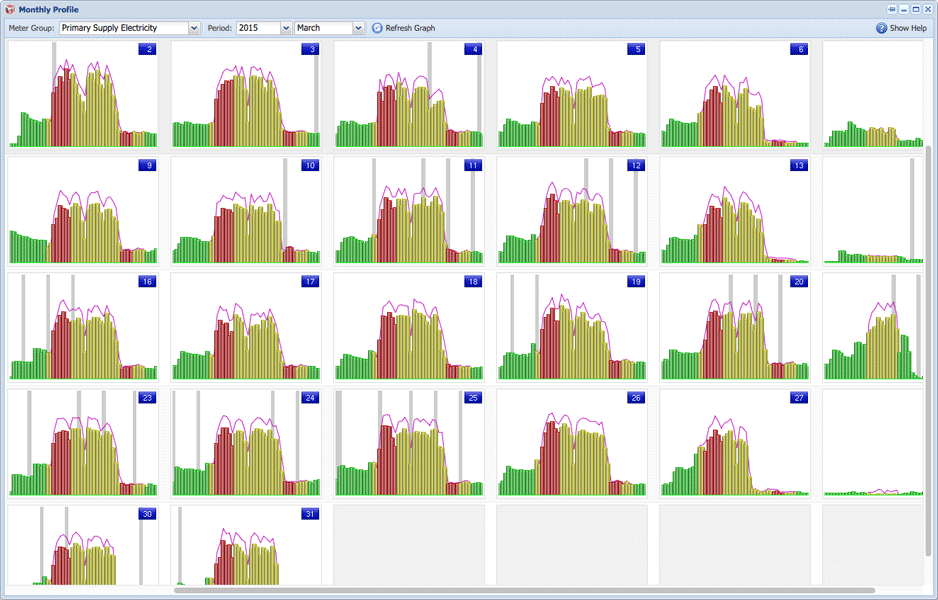
Monthly profile
The Monthly Profile utility shows a composite load profile graph that shows an overview of consumption for an entire month.
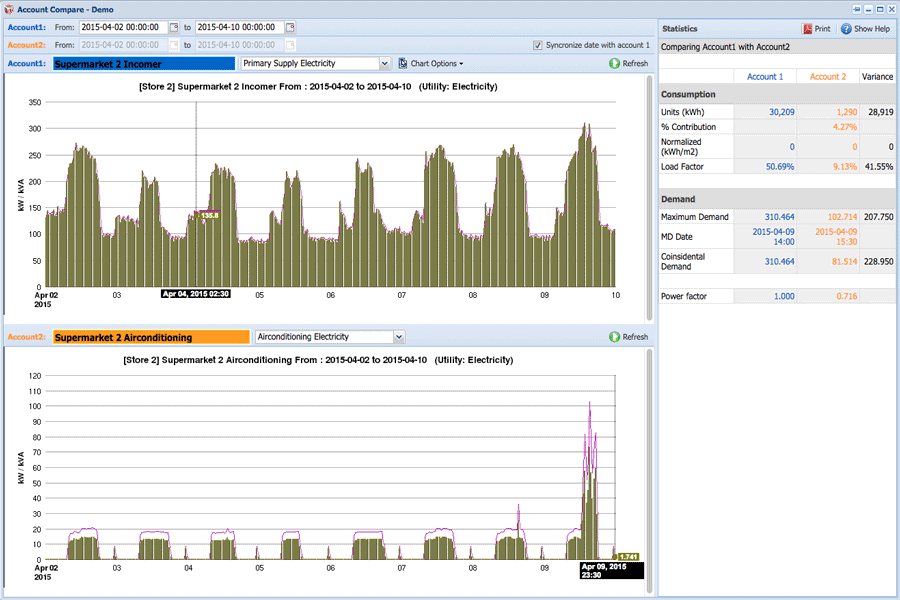
Profile comparison
The Profile Comparison tool allows direct comparison of interval data for two accounts.
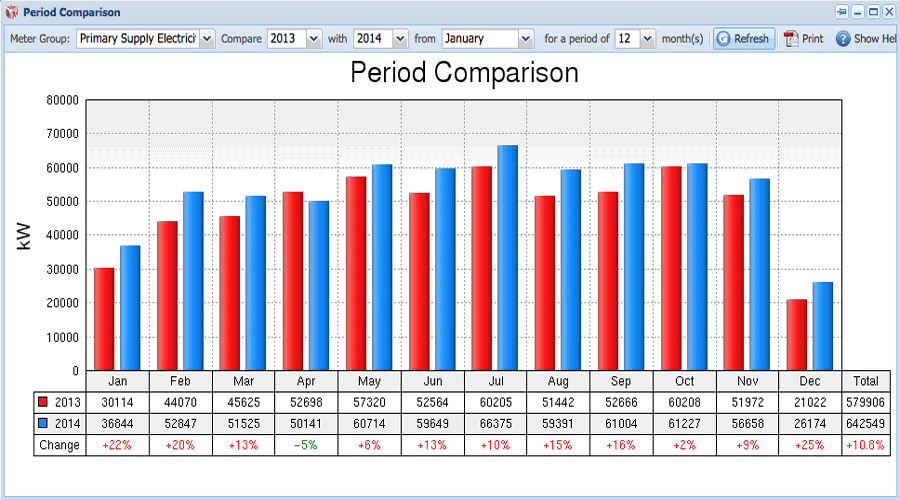
Period comparison
The Period Comparison utility shows the month-on-month comparative consumption for an account in both graphical and tabular form.